A02 - Graphical Exploration#
Revised
21 May 2023
Programming Environment#
packages <- c(
  'COUNT',
  'dcData',
  'esquisse',
  'mosaic',
  'rmarkdown',
  'tidytuesdayR',
  'tidyverse'
)

# Install packages not yet installed
installed_packages <- packages %in% rownames(installed.packages())
if (any(installed_packages == FALSE)) {
  install.packages(packages[!installed_packages])
}

# Load packages
invisible(lapply(packages, library, character.only = TRUE))

sessionInfo()
Loading required package: msme
Loading required package: MASS
Loading required package: lattice
Loading required package: sandwich
Registered S3 method overwritten by 'mosaic':
  method                           from
  fortify.SpatialPolygonsDataFrame ggplot2
The 'mosaic' package masks several functions from core packages in order to add
additional features.  The original behavior of these functions should not be affected by this.
Attaching package: ‘mosaic’
The following objects are masked from ‘package:dplyr’:

    count, do, tally
The following object is masked from ‘package:Matrix’:

    mean
The following object is masked from ‘package:ggplot2’:

    stat
The following objects are masked from ‘package:stats’:

    binom.test, cor, cor.test, cov, fivenum, IQR, median, prop.test,
    quantile, sd, t.test, var
The following objects are masked from ‘package:base’:

    max, mean, min, prod, range, sample, sum
── Attaching core tidyverse packages ───────────────────────────────────────────────────────────────────────────────────────────────────────────────────────────────────────────────────────────────────────────────────────────── tidyverse 2.0.0 ──
✔ forcats   1.0.0     ✔ stringr   1.5.0
✔ lubridate 1.9.2     ✔ tibble    3.2.1
✔ purrr     1.0.2     ✔ tidyr     1.3.0
✔ readr     2.1.4
── Conflicts ─────────────────────────────────────────────────────────────────────────────────────────────────────────────────────────────────────────────────────────────────────────────────────────────────────────────── tidyverse_conflicts() ──
✖ mosaic::count() masks dplyr::count()
✖ purrr::cross()  masks mosaic::cross()
✖ mosaic::do()    masks dplyr::do()
✖ tidyr::expand() masks Matrix::expand()
✖ dplyr::filter() masks stats::filter()
✖ dplyr::lag()    masks stats::lag()
✖ tidyr::pack()   masks Matrix::pack()
✖ dplyr::select() masks MASS::select()
✖ mosaic::stat()  masks ggplot2::stat()
✖ mosaic::tally() masks dplyr::tally()
✖ tidyr::unpack() masks Matrix::unpack()
ℹ Use the conflicted package (<http://conflicted.r-lib.org/>) to force all conflicts to become errors
R version 4.3.0 (2023-04-21)
Platform: aarch64-apple-darwin20 (64-bit)
Running under: macOS 14.4.1

Matrix products: default
BLAS:   /Library/Frameworks/R.framework/Versions/4.3-arm64/Resources/lib/libRblas.0.dylib
LAPACK: /Library/Frameworks/R.framework/Versions/4.3-arm64/Resources/lib/libRlapack.dylib;  LAPACK version 3.11.0

locale:
[1] en_US.UTF-8/en_US.UTF-8/en_US.UTF-8/C/en_US.UTF-8/en_US.UTF-8

time zone: America/New_York
tzcode source: internal

attached base packages:
[1] stats     graphics  grDevices utils     datasets  methods   base

other attached packages:
 [1] lubridate_1.9.2    forcats_1.0.0      stringr_1.5.0      purrr_1.0.2
 [5] readr_2.1.4        tidyr_1.3.0        tibble_3.2.1       tidyverse_2.0.0
 [9] tidytuesdayR_1.0.2 rmarkdown_2.22     mosaic_1.8.4.2     mosaicData_0.20.3
[13] ggformula_0.10.4   dplyr_1.1.2        Matrix_1.5-4       ggplot2_3.4.3
[17] esquisse_1.1.2     dcData_0.1.0       COUNT_1.3.4        sandwich_3.0-2
[21] msme_0.5.3         lattice_0.21-8     MASS_7.3-58.4

loaded via a namespace (and not attached):
 [1] writexl_1.4.2       tidyselect_1.2.0    IRdisplay_1.1
 [4] farver_2.1.1        fastmap_1.1.1       tweenr_2.0.2
 [7] promises_1.2.0.1    labelled_2.11.0     digest_0.6.31
[10] timechange_0.2.0    mime_0.12           lifecycle_1.0.3
[13] ellipsis_0.3.2      magrittr_2.0.3      compiler_4.3.0
[16] rlang_1.1.1         sass_0.4.6          tools_4.3.0
[19] utf8_1.2.3          data.table_1.14.8   knitr_1.43
[22] htmlwidgets_1.6.2   curl_5.0.2          shinybusy_0.3.1
[25] ggstance_0.3.6      xml2_1.3.4          repr_1.1.6
[28] pbdZMQ_0.3-9        foreign_0.8-84      withr_2.5.0
[31] shinyWidgets_0.7.6  grid_4.3.0          polyclip_1.10-4
[34] mosaicCore_0.9.2.1  fansi_1.0.4         xtable_1.8-4
[37] colorspace_2.1-0    scales_1.2.1        ggridges_0.5.4
[40] cli_3.6.1           crayon_1.5.2        datamods_1.4.0
[43] generics_0.1.3      rstudioapi_0.15.0   tzdb_0.4.0
[46] httr_1.4.6          readxl_1.4.2        cachem_1.0.8
[49] ggforce_0.4.1       rvest_1.0.3         cellranger_1.1.0
[52] base64enc_0.1-3     vctrs_0.6.3         jsonlite_1.8.5
[55] hms_1.1.3           jquerylib_0.1.4     rio_0.5.29
[58] glue_1.6.2          stringi_1.7.12      gtable_0.3.3
[61] later_1.3.1         munsell_0.5.0       pillar_1.9.0
[64] htmltools_0.5.5     IRkernel_1.3.2      reactable_0.4.4
[67] R6_2.5.1            evaluate_0.21       shiny_1.7.4
[70] haven_2.5.2         openxlsx_4.2.5.2    httpuv_1.6.11
[73] bslib_0.5.0         phosphoricons_0.1.2 Rcpp_1.0.10
[76] zip_2.3.0           uuid_1.1-0          xfun_0.39
[79] fs_1.6.2            usethis_2.1.6       zoo_1.8-12
[82] pkgconfig_2.0.3
glyph (mark, symbol) - the basic graphical unit, often corresponding to a case
e.g., scatter, density, bar, etc.
aesthetic - a visual property of a glyph (e.g., position, size, shape, color, etc.)
may be mapped, based on the data values (e.g., sex -> color)
may be set, or fixed to arbitrary non-data values (color=blue)
scale - a mapping that translates data values to aesthetics
frame - the position scale, describing how data are mapped to the coordinate system
What are the axis limits?
What kind of scale?: linear, logarithmic, etc.
guide - the legend, helpful for the reader to translage aesthetics back to data values
axis ticks, axis labels; legend; labels
facet
layer
stat
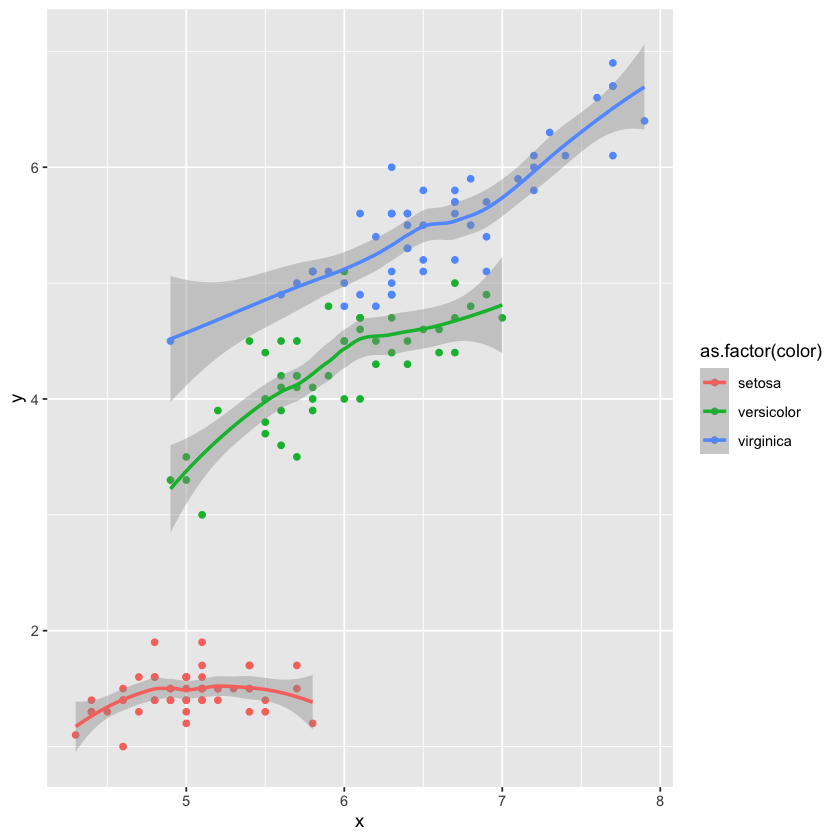
data('iris')
iris.glyphready <- iris %>%
rename(x=Sepal.Length,y=Petal.Length,color=Species)
head(iris.glyphready)
ggplot(data=iris.glyphready,aes(x=x,y=y,color=as.factor(color))) +
geom_point() +
geom_smooth(se=TRUE)
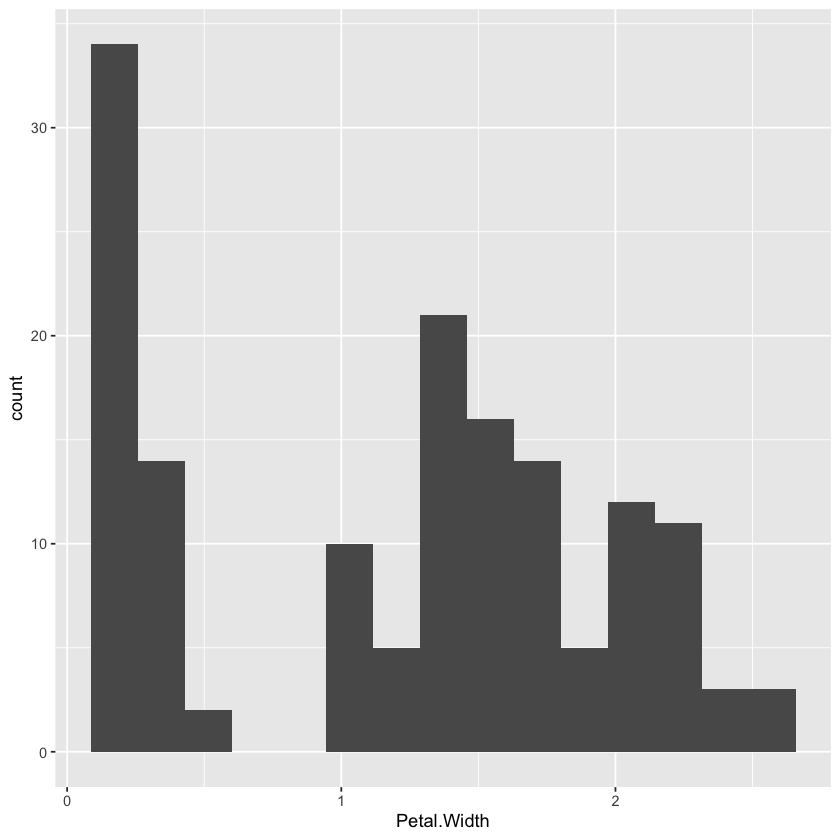
ggplot(data=iris,aes(x=Petal.Width)) +
geom_histogram(bins=15)
| x | Sepal.Width | y | Petal.Width | color | |
|---|---|---|---|---|---|
| <dbl> | <dbl> | <dbl> | <dbl> | <fct> | |
| 1 | 5.1 | 3.5 | 1.4 | 0.2 | setosa |
| 2 | 4.9 | 3.0 | 1.4 | 0.2 | setosa |
| 3 | 4.7 | 3.2 | 1.3 | 0.2 | setosa |
| 4 | 4.6 | 3.1 | 1.5 | 0.2 | setosa |
| 5 | 5.0 | 3.6 | 1.4 | 0.2 | setosa |
| 6 | 5.4 | 3.9 | 1.7 | 0.4 | setosa |
`geom_smooth()` using method = 'loess' and formula = 'y ~ x'
A02#
data('diamonds',package='ggplot2')
diamonds
| carat | cut | color | clarity | depth | table | price | x | y | z |
|---|---|---|---|---|---|---|---|---|---|
| <dbl> | <ord> | <ord> | <ord> | <dbl> | <dbl> | <int> | <dbl> | <dbl> | <dbl> |
| 0.23 | Ideal | E | SI2 | 61.5 | 55 | 326 | 3.95 | 3.98 | 2.43 |
| 0.21 | Premium | E | SI1 | 59.8 | 61 | 326 | 3.89 | 3.84 | 2.31 |
| 0.23 | Good | E | VS1 | 56.9 | 65 | 327 | 4.05 | 4.07 | 2.31 |
| 0.29 | Premium | I | VS2 | 62.4 | 58 | 334 | 4.20 | 4.23 | 2.63 |
| 0.31 | Good | J | SI2 | 63.3 | 58 | 335 | 4.34 | 4.35 | 2.75 |
| 0.24 | Very Good | J | VVS2 | 62.8 | 57 | 336 | 3.94 | 3.96 | 2.48 |
| 0.24 | Very Good | I | VVS1 | 62.3 | 57 | 336 | 3.95 | 3.98 | 2.47 |
| 0.26 | Very Good | H | SI1 | 61.9 | 55 | 337 | 4.07 | 4.11 | 2.53 |
| 0.22 | Fair | E | VS2 | 65.1 | 61 | 337 | 3.87 | 3.78 | 2.49 |
| 0.23 | Very Good | H | VS1 | 59.4 | 61 | 338 | 4.00 | 4.05 | 2.39 |
| 0.30 | Good | J | SI1 | 64.0 | 55 | 339 | 4.25 | 4.28 | 2.73 |
| 0.23 | Ideal | J | VS1 | 62.8 | 56 | 340 | 3.93 | 3.90 | 2.46 |
| 0.22 | Premium | F | SI1 | 60.4 | 61 | 342 | 3.88 | 3.84 | 2.33 |
| 0.31 | Ideal | J | SI2 | 62.2 | 54 | 344 | 4.35 | 4.37 | 2.71 |
| 0.20 | Premium | E | SI2 | 60.2 | 62 | 345 | 3.79 | 3.75 | 2.27 |
| 0.32 | Premium | E | I1 | 60.9 | 58 | 345 | 4.38 | 4.42 | 2.68 |
| 0.30 | Ideal | I | SI2 | 62.0 | 54 | 348 | 4.31 | 4.34 | 2.68 |
| 0.30 | Good | J | SI1 | 63.4 | 54 | 351 | 4.23 | 4.29 | 2.70 |
| 0.30 | Good | J | SI1 | 63.8 | 56 | 351 | 4.23 | 4.26 | 2.71 |
| 0.30 | Very Good | J | SI1 | 62.7 | 59 | 351 | 4.21 | 4.27 | 2.66 |
| 0.30 | Good | I | SI2 | 63.3 | 56 | 351 | 4.26 | 4.30 | 2.71 |
| 0.23 | Very Good | E | VS2 | 63.8 | 55 | 352 | 3.85 | 3.92 | 2.48 |
| 0.23 | Very Good | H | VS1 | 61.0 | 57 | 353 | 3.94 | 3.96 | 2.41 |
| 0.31 | Very Good | J | SI1 | 59.4 | 62 | 353 | 4.39 | 4.43 | 2.62 |
| 0.31 | Very Good | J | SI1 | 58.1 | 62 | 353 | 4.44 | 4.47 | 2.59 |
| 0.23 | Very Good | G | VVS2 | 60.4 | 58 | 354 | 3.97 | 4.01 | 2.41 |
| 0.24 | Premium | I | VS1 | 62.5 | 57 | 355 | 3.97 | 3.94 | 2.47 |
| 0.30 | Very Good | J | VS2 | 62.2 | 57 | 357 | 4.28 | 4.30 | 2.67 |
| 0.23 | Very Good | D | VS2 | 60.5 | 61 | 357 | 3.96 | 3.97 | 2.40 |
| 0.23 | Very Good | F | VS1 | 60.9 | 57 | 357 | 3.96 | 3.99 | 2.42 |
| ⋮ | ⋮ | ⋮ | ⋮ | ⋮ | ⋮ | ⋮ | ⋮ | ⋮ | ⋮ |
| 0.70 | Premium | E | SI1 | 60.5 | 58 | 2753 | 5.74 | 5.77 | 3.48 |
| 0.57 | Premium | E | IF | 59.8 | 60 | 2753 | 5.43 | 5.38 | 3.23 |
| 0.61 | Premium | F | VVS1 | 61.8 | 59 | 2753 | 5.48 | 5.40 | 3.36 |
| 0.80 | Good | G | VS2 | 64.2 | 58 | 2753 | 5.84 | 5.81 | 3.74 |
| 0.84 | Good | I | VS1 | 63.7 | 59 | 2753 | 5.94 | 5.90 | 3.77 |
| 0.77 | Ideal | E | SI2 | 62.1 | 56 | 2753 | 5.84 | 5.86 | 3.63 |
| 0.74 | Good | D | SI1 | 63.1 | 59 | 2753 | 5.71 | 5.74 | 3.61 |
| 0.90 | Very Good | J | SI1 | 63.2 | 60 | 2753 | 6.12 | 6.09 | 3.86 |
| 0.76 | Premium | I | VS1 | 59.3 | 62 | 2753 | 5.93 | 5.85 | 3.49 |
| 0.76 | Ideal | I | VVS1 | 62.2 | 55 | 2753 | 5.89 | 5.87 | 3.66 |
| 0.70 | Very Good | E | VS2 | 62.4 | 60 | 2755 | 5.57 | 5.61 | 3.49 |
| 0.70 | Very Good | E | VS2 | 62.8 | 60 | 2755 | 5.59 | 5.65 | 3.53 |
| 0.70 | Very Good | D | VS1 | 63.1 | 59 | 2755 | 5.67 | 5.58 | 3.55 |
| 0.73 | Ideal | I | VS2 | 61.3 | 56 | 2756 | 5.80 | 5.84 | 3.57 |
| 0.73 | Ideal | I | VS2 | 61.6 | 55 | 2756 | 5.82 | 5.84 | 3.59 |
| 0.79 | Ideal | I | SI1 | 61.6 | 56 | 2756 | 5.95 | 5.97 | 3.67 |
| 0.71 | Ideal | E | SI1 | 61.9 | 56 | 2756 | 5.71 | 5.73 | 3.54 |
| 0.79 | Good | F | SI1 | 58.1 | 59 | 2756 | 6.06 | 6.13 | 3.54 |
| 0.79 | Premium | E | SI2 | 61.4 | 58 | 2756 | 6.03 | 5.96 | 3.68 |
| 0.71 | Ideal | G | VS1 | 61.4 | 56 | 2756 | 5.76 | 5.73 | 3.53 |
| 0.71 | Premium | E | SI1 | 60.5 | 55 | 2756 | 5.79 | 5.74 | 3.49 |
| 0.71 | Premium | F | SI1 | 59.8 | 62 | 2756 | 5.74 | 5.73 | 3.43 |
| 0.70 | Very Good | E | VS2 | 60.5 | 59 | 2757 | 5.71 | 5.76 | 3.47 |
| 0.70 | Very Good | E | VS2 | 61.2 | 59 | 2757 | 5.69 | 5.72 | 3.49 |
| 0.72 | Premium | D | SI1 | 62.7 | 59 | 2757 | 5.69 | 5.73 | 3.58 |
| 0.72 | Ideal | D | SI1 | 60.8 | 57 | 2757 | 5.75 | 5.76 | 3.50 |
| 0.72 | Good | D | SI1 | 63.1 | 55 | 2757 | 5.69 | 5.75 | 3.61 |
| 0.70 | Very Good | D | SI1 | 62.8 | 60 | 2757 | 5.66 | 5.68 | 3.56 |
| 0.86 | Premium | H | SI2 | 61.0 | 58 | 2757 | 6.15 | 6.12 | 3.74 |
| 0.75 | Ideal | D | SI2 | 62.2 | 55 | 2757 | 5.83 | 5.87 | 3.64 |
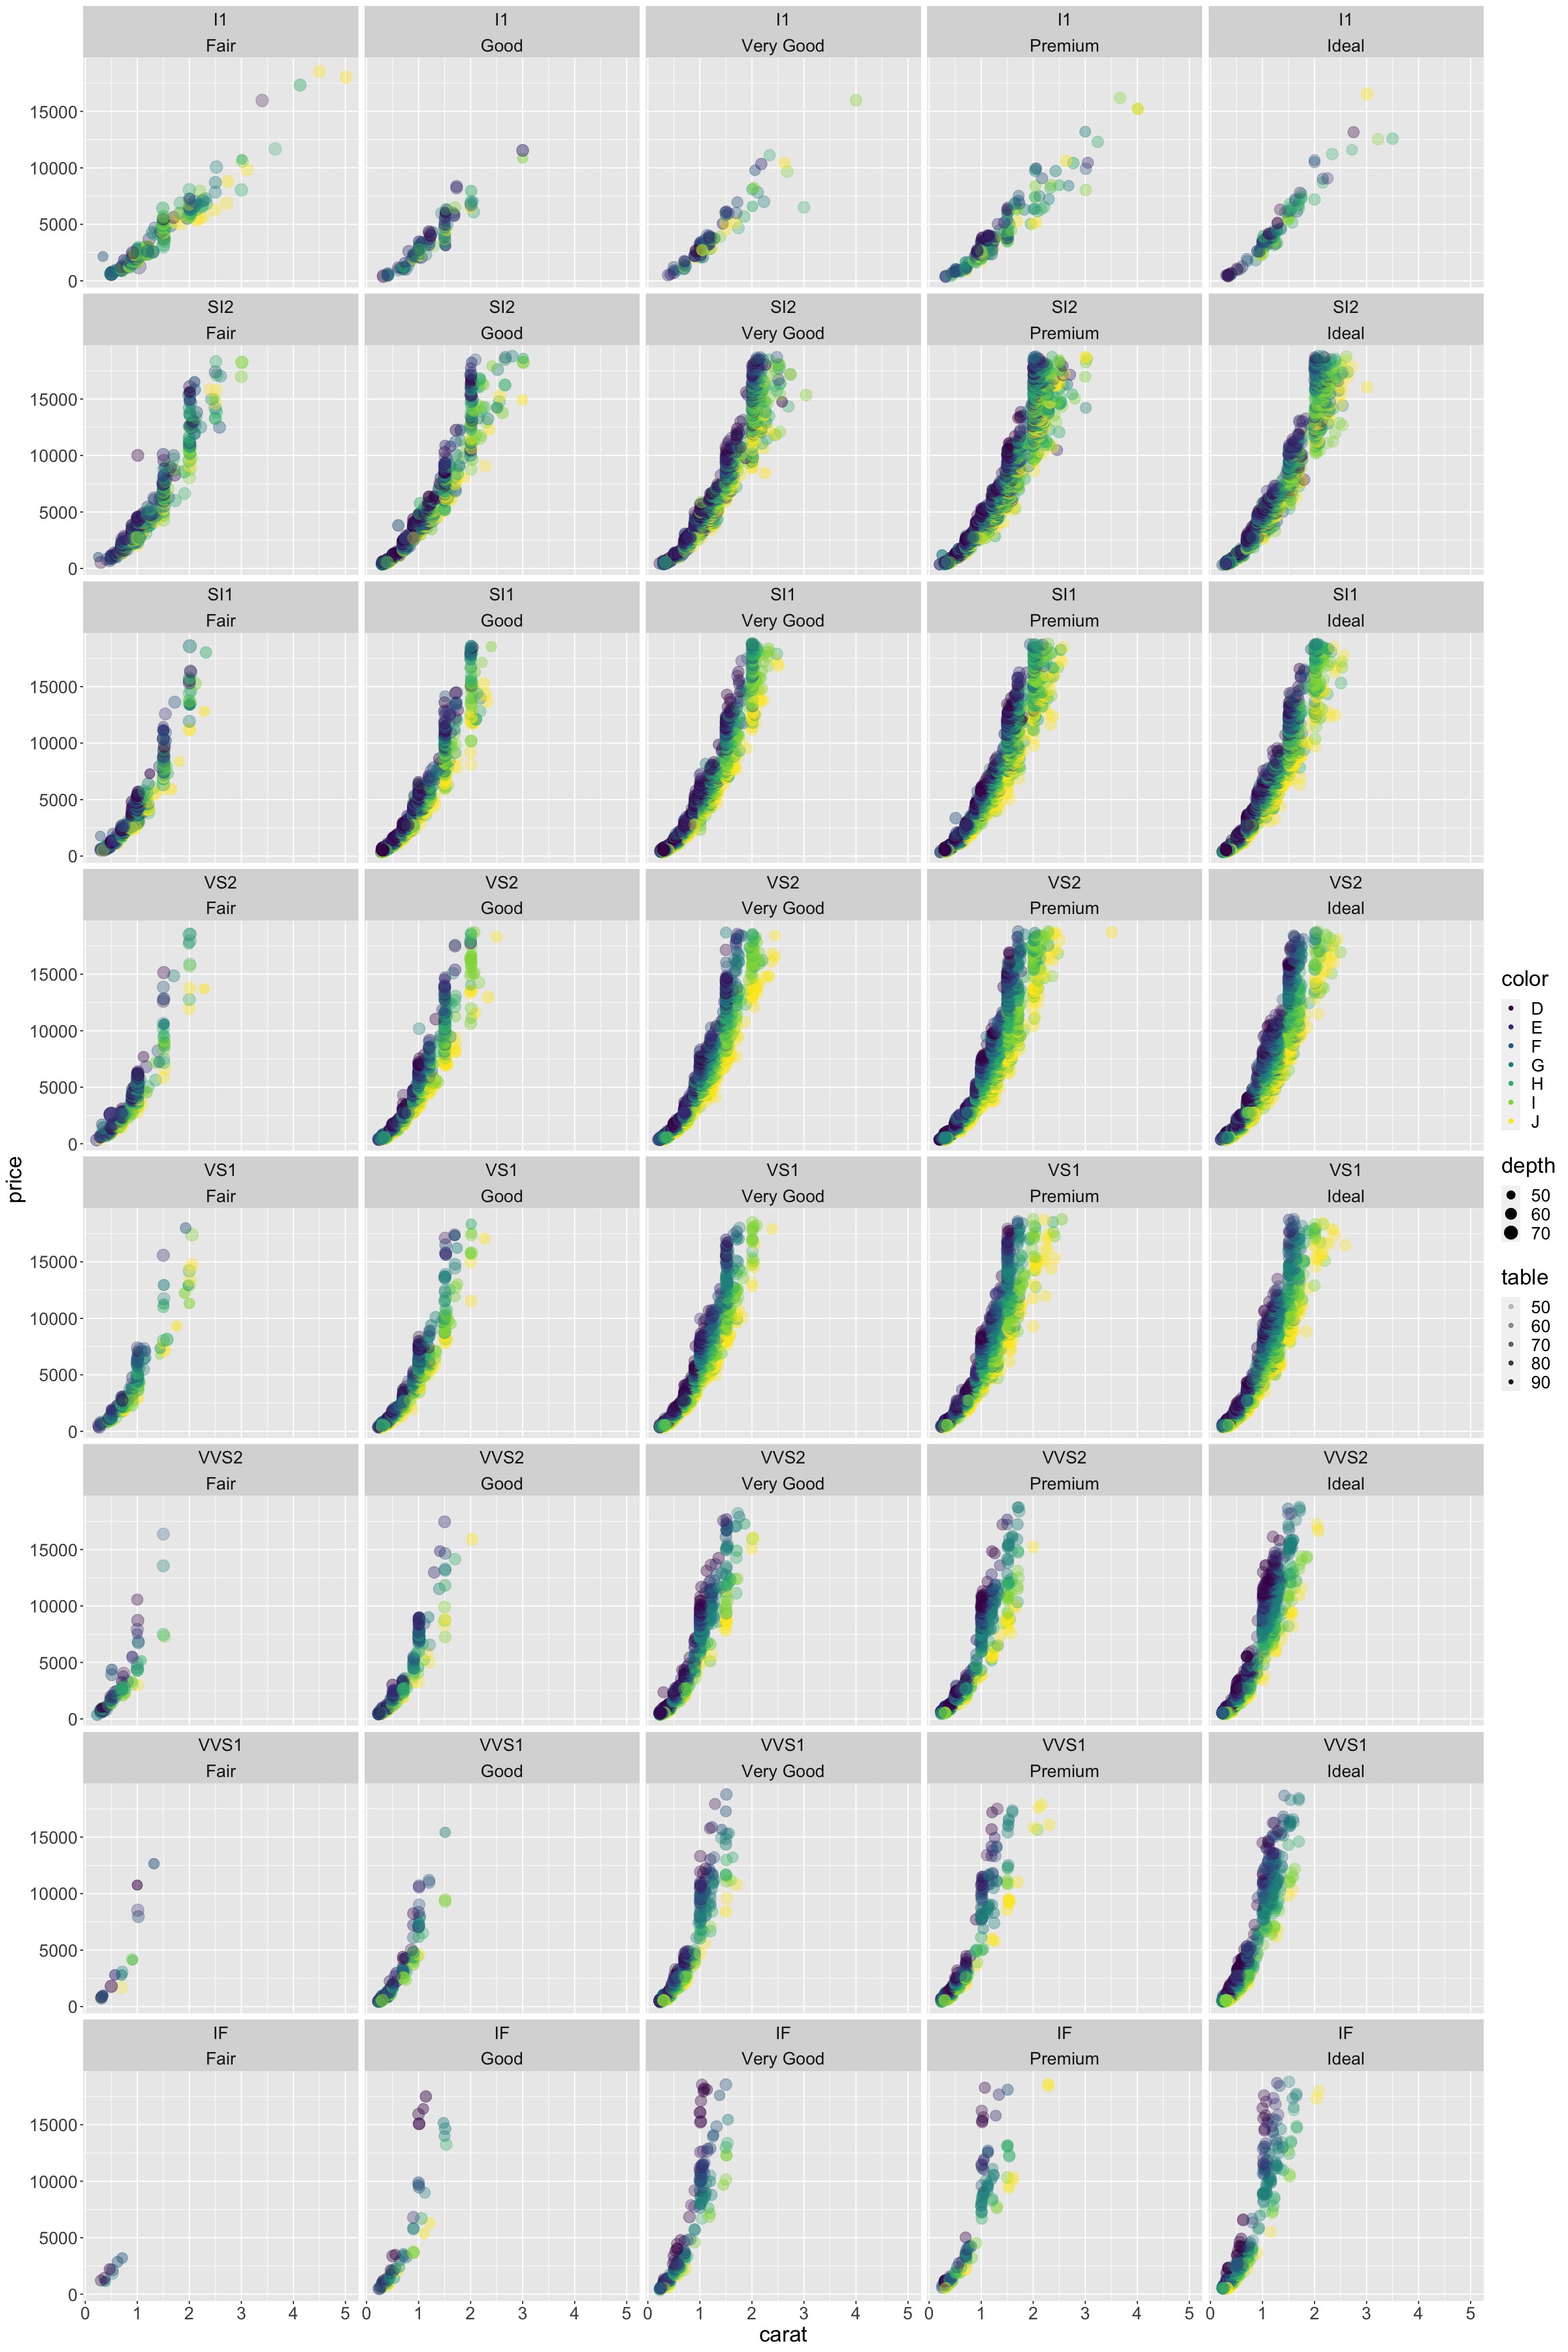
?diamonds
options(repr.plot.width=20,repr.plot.height=30)

plt <- ggplot(data=diamonds) +
  geom_point(aes(x=carat,
                 y=price,
                 color=color,
                 #shape=clarity,
                 size=depth,
                 alpha=table)) +
  facet_wrap(clarity~cut,nrow=8) +
  theme(text=element_text(size=20))
plt

#suppressWarnings(print(plt))
# https://www.kaggle.com/datasets/crawford/80-cereals
cereal <- read_csv('cereal.csv')
cereal
Rows: 77 Columns: 16
── Column specification ─────────────────────────────────────────────────────────────────────────────────────────────────────────────────────────────────────────────────────────────────────────────────────────────────────────────────────────────
Delimiter: ","
chr  (3): name, mfr, type
dbl (13): calories, protein, fat, sodium, fiber, carbo, sugars, potass, vita...
ℹ Use `spec()` to retrieve the full column specification for this data.
ℹ Specify the column types or set `show_col_types = FALSE` to quiet this message.
| name | mfr | type | calories | protein | fat | sodium | fiber | carbo | sugars | potass | vitamins | shelf | weight | cups | rating |
|---|---|---|---|---|---|---|---|---|---|---|---|---|---|---|---|
| <chr> | <chr> | <chr> | <dbl> | <dbl> | <dbl> | <dbl> | <dbl> | <dbl> | <dbl> | <dbl> | <dbl> | <dbl> | <dbl> | <dbl> | <dbl> |
| 100% Bran | N | C | 70 | 4 | 1 | 130 | 10.0 | 5.0 | 6 | 280 | 25 | 3 | 1.00 | 0.33 | 68.40297 |
| 100% Natural Bran | Q | C | 120 | 3 | 5 | 15 | 2.0 | 8.0 | 8 | 135 | 0 | 3 | 1.00 | 1.00 | 33.98368 |
| All-Bran | K | C | 70 | 4 | 1 | 260 | 9.0 | 7.0 | 5 | 320 | 25 | 3 | 1.00 | 0.33 | 59.42551 |
| All-Bran with Extra Fiber | K | C | 50 | 4 | 0 | 140 | 14.0 | 8.0 | 0 | 330 | 25 | 3 | 1.00 | 0.50 | 93.70491 |
| Almond Delight | R | C | 110 | 2 | 2 | 200 | 1.0 | 14.0 | 8 | -1 | 25 | 3 | 1.00 | 0.75 | 34.38484 |
| Apple Cinnamon Cheerios | G | C | 110 | 2 | 2 | 180 | 1.5 | 10.5 | 10 | 70 | 25 | 1 | 1.00 | 0.75 | 29.50954 |
| Apple Jacks | K | C | 110 | 2 | 0 | 125 | 1.0 | 11.0 | 14 | 30 | 25 | 2 | 1.00 | 1.00 | 33.17409 |
| Basic 4 | G | C | 130 | 3 | 2 | 210 | 2.0 | 18.0 | 8 | 100 | 25 | 3 | 1.33 | 0.75 | 37.03856 |
| Bran Chex | R | C | 90 | 2 | 1 | 200 | 4.0 | 15.0 | 6 | 125 | 25 | 1 | 1.00 | 0.67 | 49.12025 |
| Bran Flakes | P | C | 90 | 3 | 0 | 210 | 5.0 | 13.0 | 5 | 190 | 25 | 3 | 1.00 | 0.67 | 53.31381 |
| Cap'n'Crunch | Q | C | 120 | 1 | 2 | 220 | 0.0 | 12.0 | 12 | 35 | 25 | 2 | 1.00 | 0.75 | 18.04285 |
| Cheerios | G | C | 110 | 6 | 2 | 290 | 2.0 | 17.0 | 1 | 105 | 25 | 1 | 1.00 | 1.25 | 50.76500 |
| Cinnamon Toast Crunch | G | C | 120 | 1 | 3 | 210 | 0.0 | 13.0 | 9 | 45 | 25 | 2 | 1.00 | 0.75 | 19.82357 |
| Clusters | G | C | 110 | 3 | 2 | 140 | 2.0 | 13.0 | 7 | 105 | 25 | 3 | 1.00 | 0.50 | 40.40021 |
| Cocoa Puffs | G | C | 110 | 1 | 1 | 180 | 0.0 | 12.0 | 13 | 55 | 25 | 2 | 1.00 | 1.00 | 22.73645 |
| Corn Chex | R | C | 110 | 2 | 0 | 280 | 0.0 | 22.0 | 3 | 25 | 25 | 1 | 1.00 | 1.00 | 41.44502 |
| Corn Flakes | K | C | 100 | 2 | 0 | 290 | 1.0 | 21.0 | 2 | 35 | 25 | 1 | 1.00 | 1.00 | 45.86332 |
| Corn Pops | K | C | 110 | 1 | 0 | 90 | 1.0 | 13.0 | 12 | 20 | 25 | 2 | 1.00 | 1.00 | 35.78279 |
| Count Chocula | G | C | 110 | 1 | 1 | 180 | 0.0 | 12.0 | 13 | 65 | 25 | 2 | 1.00 | 1.00 | 22.39651 |
| Cracklin' Oat Bran | K | C | 110 | 3 | 3 | 140 | 4.0 | 10.0 | 7 | 160 | 25 | 3 | 1.00 | 0.50 | 40.44877 |
| Cream of Wheat (Quick) | N | H | 100 | 3 | 0 | 80 | 1.0 | 21.0 | 0 | -1 | 0 | 2 | 1.00 | 1.00 | 64.53382 |
| Crispix | K | C | 110 | 2 | 0 | 220 | 1.0 | 21.0 | 3 | 30 | 25 | 3 | 1.00 | 1.00 | 46.89564 |
| Crispy Wheat & Raisins | G | C | 100 | 2 | 1 | 140 | 2.0 | 11.0 | 10 | 120 | 25 | 3 | 1.00 | 0.75 | 36.17620 |
| Double Chex | R | C | 100 | 2 | 0 | 190 | 1.0 | 18.0 | 5 | 80 | 25 | 3 | 1.00 | 0.75 | 44.33086 |
| Froot Loops | K | C | 110 | 2 | 1 | 125 | 1.0 | 11.0 | 13 | 30 | 25 | 2 | 1.00 | 1.00 | 32.20758 |
| Frosted Flakes | K | C | 110 | 1 | 0 | 200 | 1.0 | 14.0 | 11 | 25 | 25 | 1 | 1.00 | 0.75 | 31.43597 |
| Frosted Mini-Wheats | K | C | 100 | 3 | 0 | 0 | 3.0 | 14.0 | 7 | 100 | 25 | 2 | 1.00 | 0.80 | 58.34514 |
| Fruit & Fibre Dates; Walnuts; and Oats | P | C | 120 | 3 | 2 | 160 | 5.0 | 12.0 | 10 | 200 | 25 | 3 | 1.25 | 0.67 | 40.91705 |
| Fruitful Bran | K | C | 120 | 3 | 0 | 240 | 5.0 | 14.0 | 12 | 190 | 25 | 3 | 1.33 | 0.67 | 41.01549 |
| Fruity Pebbles | P | C | 110 | 1 | 1 | 135 | 0.0 | 13.0 | 12 | 25 | 25 | 2 | 1.00 | 0.75 | 28.02576 |
| ⋮ | ⋮ | ⋮ | ⋮ | ⋮ | ⋮ | ⋮ | ⋮ | ⋮ | ⋮ | ⋮ | ⋮ | ⋮ | ⋮ | ⋮ | ⋮ |
| Multi-Grain Cheerios | G | C | 100 | 2 | 1 | 220 | 2.0 | 15.0 | 6 | 90 | 25 | 1 | 1.00 | 1.00 | 40.10596 |
| Nut&Honey Crunch | K | C | 120 | 2 | 1 | 190 | 0.0 | 15.0 | 9 | 40 | 25 | 2 | 1.00 | 0.67 | 29.92429 |
| Nutri-Grain Almond-Raisin | K | C | 140 | 3 | 2 | 220 | 3.0 | 21.0 | 7 | 130 | 25 | 3 | 1.33 | 0.67 | 40.69232 |
| Nutri-grain Wheat | K | C | 90 | 3 | 0 | 170 | 3.0 | 18.0 | 2 | 90 | 25 | 3 | 1.00 | 1.00 | 59.64284 |
| Oatmeal Raisin Crisp | G | C | 130 | 3 | 2 | 170 | 1.5 | 13.5 | 10 | 120 | 25 | 3 | 1.25 | 0.50 | 30.45084 |
| Post Nat. Raisin Bran | P | C | 120 | 3 | 1 | 200 | 6.0 | 11.0 | 14 | 260 | 25 | 3 | 1.33 | 0.67 | 37.84059 |
| Product 19 | K | C | 100 | 3 | 0 | 320 | 1.0 | 20.0 | 3 | 45 | 100 | 3 | 1.00 | 1.00 | 41.50354 |
| Puffed Rice | Q | C | 50 | 1 | 0 | 0 | 0.0 | 13.0 | 0 | 15 | 0 | 3 | 0.50 | 1.00 | 60.75611 |
| Puffed Wheat | Q | C | 50 | 2 | 0 | 0 | 1.0 | 10.0 | 0 | 50 | 0 | 3 | 0.50 | 1.00 | 63.00565 |
| Quaker Oat Squares | Q | C | 100 | 4 | 1 | 135 | 2.0 | 14.0 | 6 | 110 | 25 | 3 | 1.00 | 0.50 | 49.51187 |
| Quaker Oatmeal | Q | H | 100 | 5 | 2 | 0 | 2.7 | -1.0 | -1 | 110 | 0 | 1 | 1.00 | 0.67 | 50.82839 |
| Raisin Bran | K | C | 120 | 3 | 1 | 210 | 5.0 | 14.0 | 12 | 240 | 25 | 2 | 1.33 | 0.75 | 39.25920 |
| Raisin Nut Bran | G | C | 100 | 3 | 2 | 140 | 2.5 | 10.5 | 8 | 140 | 25 | 3 | 1.00 | 0.50 | 39.70340 |
| Raisin Squares | K | C | 90 | 2 | 0 | 0 | 2.0 | 15.0 | 6 | 110 | 25 | 3 | 1.00 | 0.50 | 55.33314 |
| Rice Chex | R | C | 110 | 1 | 0 | 240 | 0.0 | 23.0 | 2 | 30 | 25 | 1 | 1.00 | 1.13 | 41.99893 |
| Rice Krispies | K | C | 110 | 2 | 0 | 290 | 0.0 | 22.0 | 3 | 35 | 25 | 1 | 1.00 | 1.00 | 40.56016 |
| Shredded Wheat | N | C | 80 | 2 | 0 | 0 | 3.0 | 16.0 | 0 | 95 | 0 | 1 | 0.83 | 1.00 | 68.23588 |
| Shredded Wheat 'n'Bran | N | C | 90 | 3 | 0 | 0 | 4.0 | 19.0 | 0 | 140 | 0 | 1 | 1.00 | 0.67 | 74.47295 |
| Shredded Wheat spoon size | N | C | 90 | 3 | 0 | 0 | 3.0 | 20.0 | 0 | 120 | 0 | 1 | 1.00 | 0.67 | 72.80179 |
| Smacks | K | C | 110 | 2 | 1 | 70 | 1.0 | 9.0 | 15 | 40 | 25 | 2 | 1.00 | 0.75 | 31.23005 |
| Special K | K | C | 110 | 6 | 0 | 230 | 1.0 | 16.0 | 3 | 55 | 25 | 1 | 1.00 | 1.00 | 53.13132 |
| Strawberry Fruit Wheats | N | C | 90 | 2 | 0 | 15 | 3.0 | 15.0 | 5 | 90 | 25 | 2 | 1.00 | 1.00 | 59.36399 |
| Total Corn Flakes | G | C | 110 | 2 | 1 | 200 | 0.0 | 21.0 | 3 | 35 | 100 | 3 | 1.00 | 1.00 | 38.83975 |
| Total Raisin Bran | G | C | 140 | 3 | 1 | 190 | 4.0 | 15.0 | 14 | 230 | 100 | 3 | 1.50 | 1.00 | 28.59278 |
| Total Whole Grain | G | C | 100 | 3 | 1 | 200 | 3.0 | 16.0 | 3 | 110 | 100 | 3 | 1.00 | 1.00 | 46.65884 |
| Triples | G | C | 110 | 2 | 1 | 250 | 0.0 | 21.0 | 3 | 60 | 25 | 3 | 1.00 | 0.75 | 39.10617 |
| Trix | G | C | 110 | 1 | 1 | 140 | 0.0 | 13.0 | 12 | 25 | 25 | 2 | 1.00 | 1.00 | 27.75330 |
| Wheat Chex | R | C | 100 | 3 | 1 | 230 | 3.0 | 17.0 | 3 | 115 | 25 | 1 | 1.00 | 0.67 | 49.78744 |
| Wheaties | G | C | 100 | 3 | 1 | 200 | 3.0 | 17.0 | 3 | 110 | 25 | 1 | 1.00 | 1.00 | 51.59219 |
| Wheaties Honey Gold | G | C | 110 | 2 | 1 | 200 | 1.0 | 16.0 | 8 | 60 | 25 | 1 | 1.00 | 0.75 | 36.18756 |
cereal %>%
  count(mfr) %>%
    arrange(desc(n))
cereal %>%
  count(type) %>%
    arrange(desc(n))
cereal %>%
  count(calories) %>%
    arrange(desc(n))
cereal %>%
  count(protein) %>%
    arrange(desc(n))
cereal %>%
  count(fat) %>%
    arrange(desc(n))
| mfr | n |
|---|---|
| <chr> | <int> |
| K | 23 |
| G | 22 |
| P | 9 |
| Q | 8 |
| R | 8 |
| N | 6 |
| A | 1 |
| type | n |
|---|---|
| <chr> | <int> |
| C | 74 |
| H | 3 |
| calories | n |
|---|---|
| <dbl> | <int> |
| 110 | 29 |
| 100 | 17 |
| 120 | 10 |
| 90 | 7 |
| 50 | 3 |
| 140 | 3 |
| 70 | 2 |
| 130 | 2 |
| 150 | 2 |
| 80 | 1 |
| 160 | 1 |
| protein | n |
|---|---|
| <dbl> | <int> |
| 3 | 28 |
| 2 | 25 |
| 1 | 13 |
| 4 | 8 |
| 6 | 2 |
| 5 | 1 |
| fat | n |
|---|---|
| <dbl> | <int> |
| 1 | 30 |
| 0 | 27 |
| 2 | 14 |
| 3 | 5 |
| 5 | 1 |
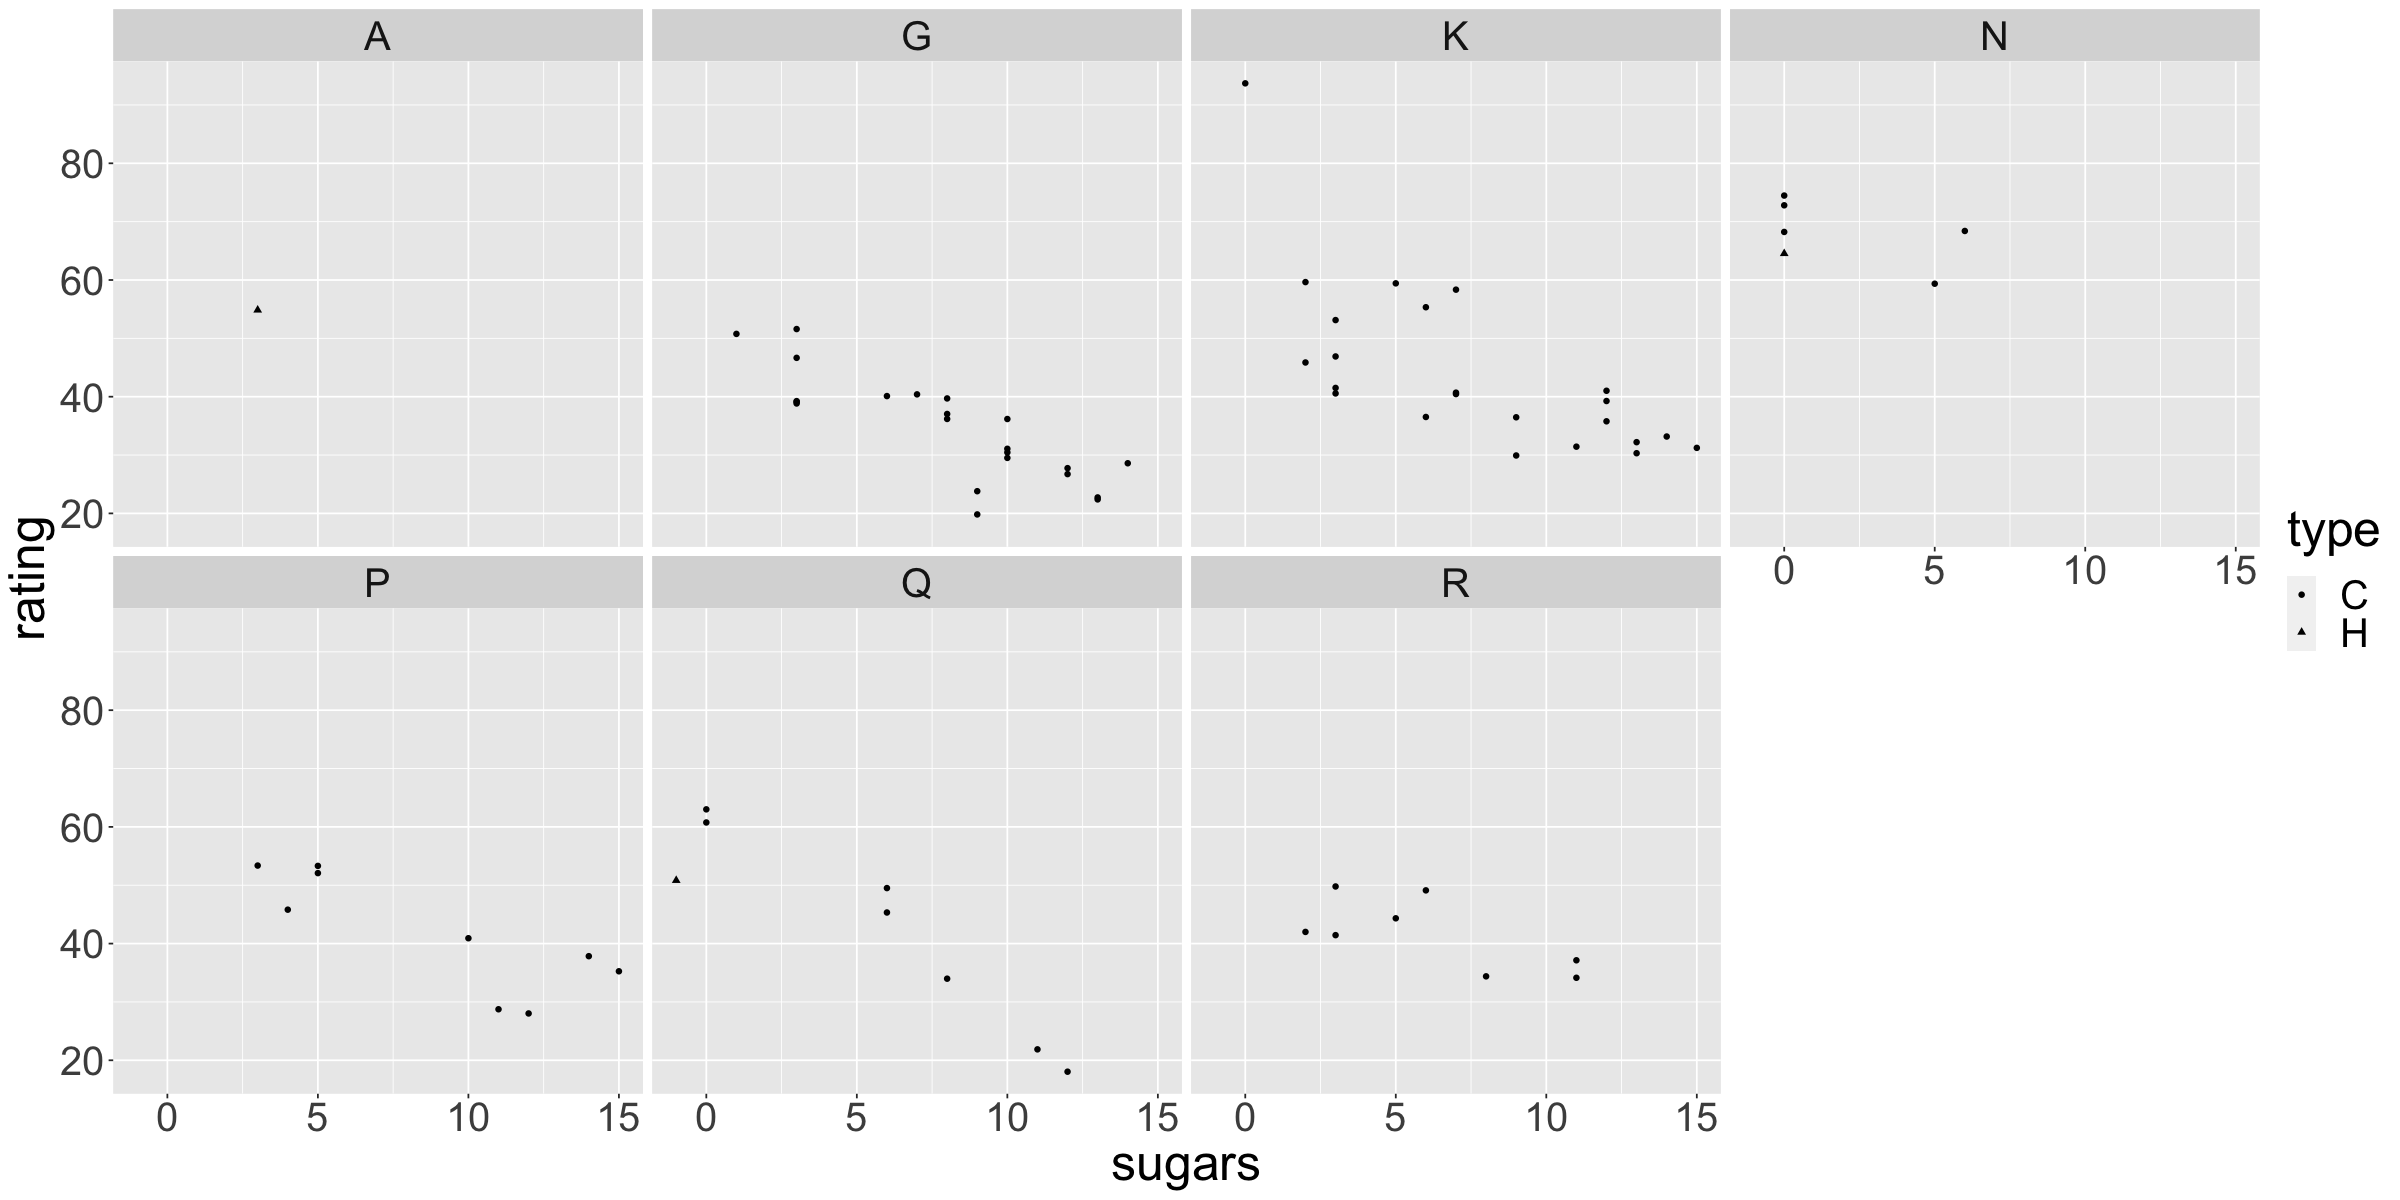
options(repr.plot.width=20,repr.plot.height=10)

plt <- ggplot(data=cereal) +
  geom_point(aes(x=sugars,
                 y=rating,
                 #color=color,
                 shape=type)) +
                 #size=depth,
                 #alpha=table)) +
  facet_wrap(~mfr,nrow=2) +
  theme(text=element_text(size=30))
plt

#suppressWarnings(print(plt))